
The view from my imaging position in my garden provides a reasonable view East to South West but also has a range of obstructions from 15 degrees altitude to 25 degrees.
From the north and elsewhere the view is even more restricted with obstructions ranging from 45 degrees altitude to 84 degrees.
To avoid these obstructions when planning what to photograph I decided to create a custom horizon line for all the software I use.
This has proved to be extremely helpful. It has enabled me to see exactly when I am able to take photograph low on the horizon as the objects move between low and high roof line obstructions.
Step 1 – Create a panorama view of the view from your mount position. I used my iPhone to do this, creating 2 panoramas, the first covering 0-180 degrees azimuth and the second 180-360 degrees, with some overlap. The 2 images were then overlapped in Photoshop and cropped to show an exact 0-360 degree view. and sized to be 36 cm wide.
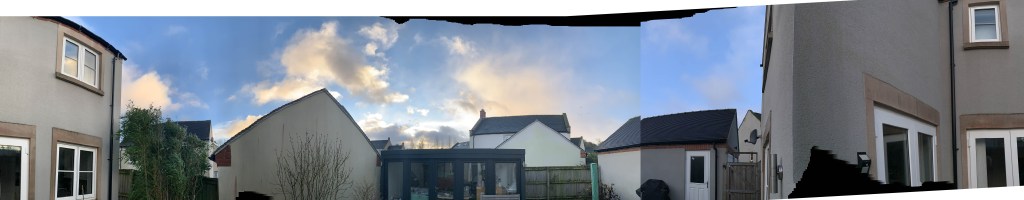
Step 2 – Mark up the image with the azimuth points where there is an altitude change in the obstruction point. This was done by using the View – Show – Grid feature in Photoshop to create a grid overlay of the image and using Edit – Preferences – Grid to specify a 1 cm sized grids with 10 subdivisions. A fairly easy job to then mark off these altitude change points as each grid line represented 1 degree of azimuth.

Step 3 – Mark up the image with the altitude for each azimuth point previously identified. I found an app for the iPhone called SeeLevel – visual clinometer. This allowed me to place the iPhone at the telescope mount position and the phone screen showed a camera view overlaid with the angle of inclination . This is done for every azimuth point – remembering that where there is a vertical obstruction there will be a top and bottom point.

Step 4 – Create a .txt file from the azimuth and altitude data. Based on the data obtained from my marked up panorama this would be:
0 62
45 47
46 33
76 33
77 17
80 17
114 35
132 15
164 15 etc
It is important to ensure that there is no duplication of the azimuth points and they are in ascending order starting from zero. For a vertical obstruction this means that the top and bottom altitude points will need to use consecutive azimuth points.
Create custom horizon in N.I.N.A – Using a text editor, save a copy of the data point file created in Step 4 as a .hrz file
Open N.I.N.A and in Options – General at the Astrometry section at the bottom left custom horizon link you need to browse and open the .hrz here.
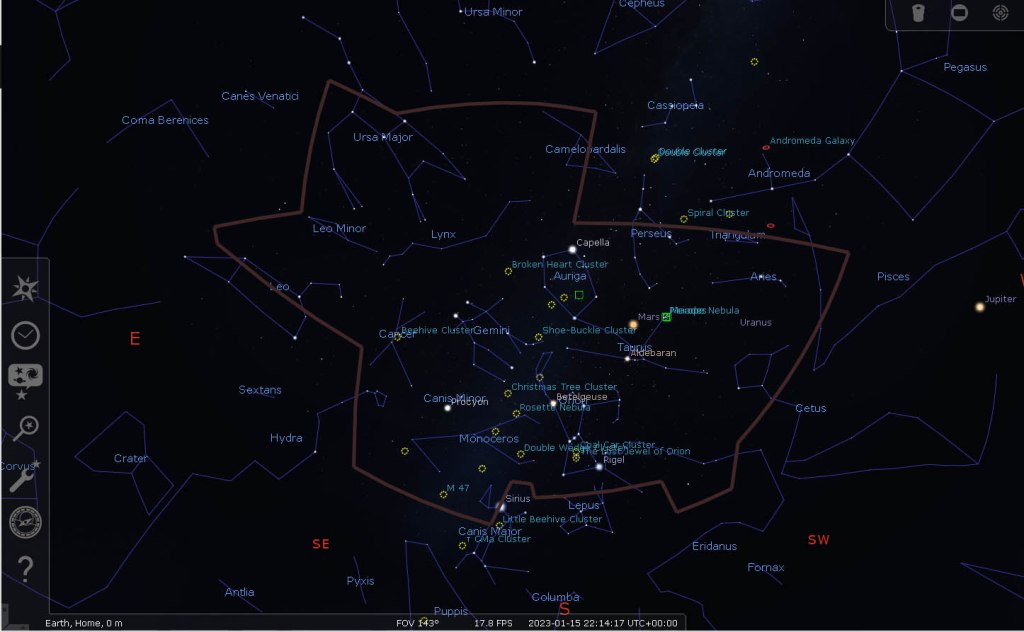
When searching using Sky Atlas or when Framing, the profile of your custom horizon will be used rather than a zero degree horizon.

Creating a custom horizon in Stellarium – A little more tricky than with N.I.N.A. Here we make use of the landscape files which are usually found in Drive/Program Files/Stellarium/landscape. Use the geneva folder and make a copy, renaming the copy folder as you wish. You will need administrative rights to do this copy.
Open your new folder and copy and paste your data point .txt file created in step 4 into this folder. I used Notepad to do this (Windows Accessories – Notepad, right click to open and run as Administrator – it is important that it is done as an Administrator).
Still using Notepad as an Administrator, open the landscape.ini file. The location data is not needed and can be deleted. Change the Geneva in name = Geneva to something different. Change the horizon_Geneve .txt in polygonal_horizon_list = horizon_Geneve.txt to the same .txt file name that you have used for your custom horizon data points in this folder. Save the changes as a .ini file.
When you open Stellarium select the Sky and Viewing Options Window (F4) and the landscape tab. The new landscape you named as a replacement for name = Geneva will now be in the list of choices. Select this, tick the boxes
– use the landscape as a default
– draw only as a polygon
– make polygon thickness 5 if you want a thicker horizon line.
Save the view and settings in the configuration file.
Creating a custom horizon in Sky Safari (iPhone or iPad)– Start again with your data points obtained in Step 4 and copy into an Excel file with the azimuth data as one column and the altitude data as the next column. The data needs to cover a range of -90 and +90 for the altitude so make additional data points of 0 -90 and 360 90.
Using the chart wizard in Excel, create an XY(scatter) chart, with no data points and no labels or names on the chart

Crop to chart to cover the data range of the horizon for both azimuth and altitude and re-scale to 2048 x 1024 pixels. The additional chart lines of -90 and +90 altitude created for 0 and 360 azimuth will show the extent of the areas to crop. Make sure these additional chart lines for -90 and +90 are erased.
Using Photoshop Select – Colour Range I selected the grey background and erased it, leaving just the graph line with a transparent background. The graph line can then be changed to whatever colour you wish for display purposes in Sky Safari. Save the final line as a .png file.
Connecting your Iphone/IPadi to a PC and running iTunes on the PC will let you access the shared files on the Iphone/Ipad. Select Sky Safari and copy and paste the line file into the folder.
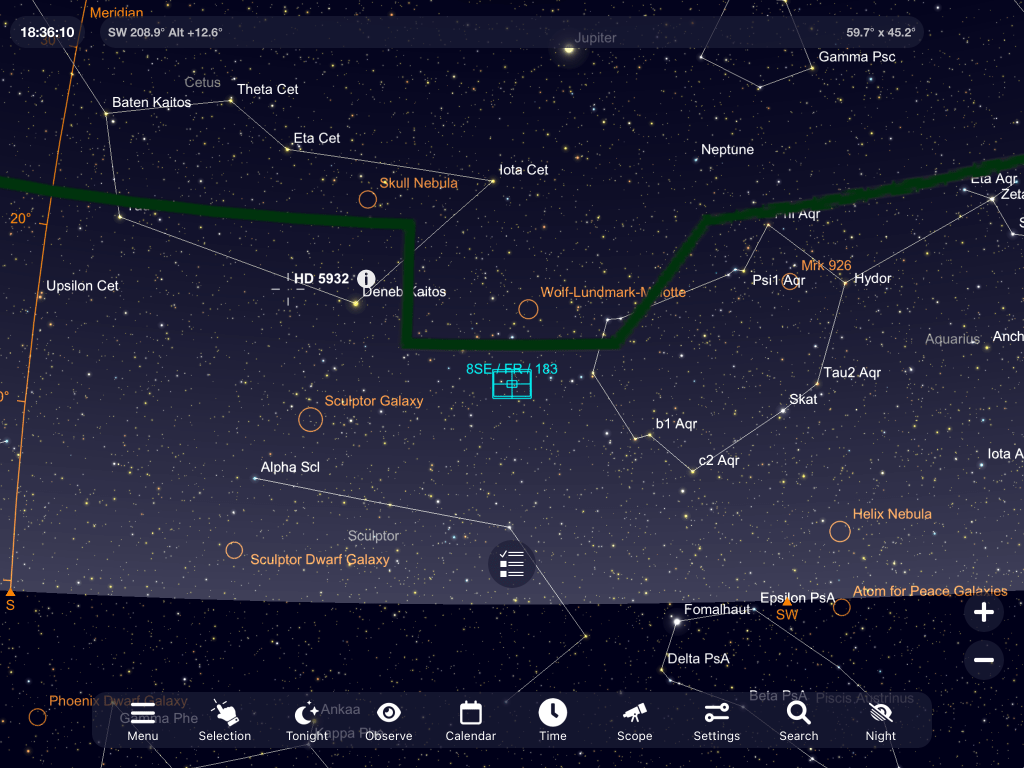
In Sky Safari, in Settings – Horizon & Sky, select Show Horizon & Sky as Panoramic Image and select the new file from the Panorama Horizon list.
All done
